|
|
 Books/Poster Indicators Patterns Blog Posts Blog Categories Combo Package Offers
  June 01 2018 .
The unwavering uptrend in stocks in the last few years may be seeing disruption with the birth of new volatility in 2018. Institutional and retail investors are looking for various gauges to look for volatilityeffects and its trends for the coming quarters. Most analysts think there may be more upside and opportunities to come this year even with all emergence of geo-political issues.
More...
June 01 2018 .
The unwavering uptrend in stocks in the last few years may be seeing disruption with the birth of new volatility in 2018. Institutional and retail investors are looking for various gauges to look for volatilityeffects and its trends for the coming quarters. Most analysts think there may be more upside and opportunities to come this year even with all emergence of geo-political issues.
More...
 May 01 2018 .
Financial Technologies - Fintech is the technologies used and applied in the Financial services sector. In the recent decade or so due to the technological innovations Fintech is disrupting traditional financial services sectors in retail banking/investment/mobile payments/loans/fund-raising and asset management. Fintech is also changing customer behavior and expectations as they are now able to access data and information anywhere and everywhere.
More...
May 01 2018 .
Financial Technologies - Fintech is the technologies used and applied in the Financial services sector. In the recent decade or so due to the technological innovations Fintech is disrupting traditional financial services sectors in retail banking/investment/mobile payments/loans/fund-raising and asset management. Fintech is also changing customer behavior and expectations as they are now able to access data and information anywhere and everywhere.
More...
 Apr 01 2018 .
The Energy sector ranked the last in the sector performances in 2017. In June 2017 Crude oil traded at a low of 42.37 and many analysts expected lower prices with a target of 40 or lower as energy market sentiment has been bearish. Since August 2017 Crude oil showed a significant bullish trend. In the last seven months crude rallied and traded over 66 per barrel.
More...
Apr 01 2018 .
The Energy sector ranked the last in the sector performances in 2017. In June 2017 Crude oil traded at a low of 42.37 and many analysts expected lower prices with a target of 40 or lower as energy market sentiment has been bearish. Since August 2017 Crude oil showed a significant bullish trend. In the last seven months crude rallied and traded over 66 per barrel.
More...
 Mar 01 2018 .
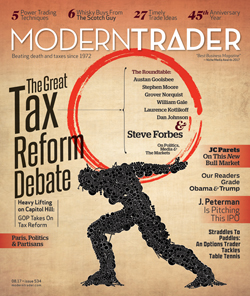
The U.S. tax overhaul bill may boost profits for many industries including technology banks telecoms and industrial companies. The centerpiece of the legislation is a reduction in the corporate income tax rate to 20% from the current 35%. Also a key provision allows companies to bring back hundreds of billions of dollars in foreign profits at a lower rate than existing rates.
More...
Mar 01 2018 .
The U.S. tax overhaul bill may boost profits for many industries including technology banks telecoms and industrial companies. The centerpiece of the legislation is a reduction in the corporate income tax rate to 20% from the current 35%. Also a key provision allows companies to bring back hundreds of billions of dollars in foreign profits at a lower rate than existing rates.
More...
 Feb 01 2018 .
The re-awakening of Artificial Intelligence and recent technological advancements have given a rebirth of robotics in the recent years. An open-source based Robotics Operating System (ROS) supported by Google has changed the robotics field for everyone to build faster and lower-cost robotics applications machinery in new start-up companies.
More...
Feb 01 2018 .
The re-awakening of Artificial Intelligence and recent technological advancements have given a rebirth of robotics in the recent years. An open-source based Robotics Operating System (ROS) supported by Google has changed the robotics field for everyone to build faster and lower-cost robotics applications machinery in new start-up companies.
More...
 Jan 01 2018 .
Wallstreet analysts have modified original FANG acronym to facilitate other stocks like FAANG adding Adobe and Apple. Here is my attempt to represent six of high-performing stocks in another acronym FANTAG for Facebook-Amazon-Netflix-Tesla-Apple-Google.
More...
Jan 01 2018 .
Wallstreet analysts have modified original FANG acronym to facilitate other stocks like FAANG adding Adobe and Apple. Here is my attempt to represent six of high-performing stocks in another acronym FANTAG for Facebook-Amazon-Netflix-Tesla-Apple-Google.
More...
 Dec 01 2017 .
Successful pattern trading requires the knowledge of pattern formation its arrangement and its market manipulation. The recognition of multiple patterns in multiple time-frames and patterns within patterns and its body of knowledge of how to react and what to expect helps a trader’s success.
More...
Dec 01 2017 .
Successful pattern trading requires the knowledge of pattern formation its arrangement and its market manipulation. The recognition of multiple patterns in multiple time-frames and patterns within patterns and its body of knowledge of how to react and what to expect helps a trader’s success.
More...
 Nov 01 2017 .
Technical Analysis is the study of behavioral patterns of various technical events. Confluence is when thereis more than one technical analysis concept coming together at the same point in the market. Traders find a setup which has multiple price concepts from various non-correlated techniques
More...
Nov 01 2017 .
Technical Analysis is the study of behavioral patterns of various technical events. Confluence is when thereis more than one technical analysis concept coming together at the same point in the market. Traders find a setup which has multiple price concepts from various non-correlated techniques
More...
 Oct 01 2017 . The primary theory behind Harmonic patterns is price/time movements which adhere to Fibonacci ratio relationships and its symmetry in markets. Fibonacci ratio analysis works well with any markets and on any time-frame charts.
More...
Oct 01 2017 . The primary theory behind Harmonic patterns is price/time movements which adhere to Fibonacci ratio relationships and its symmetry in markets. Fibonacci ratio analysis works well with any markets and on any time-frame charts.
More...
 Sep 01 2017 . The ABC Chart pattern and its related AB=CD Chart Pattern are prime examples of Symmetry in the markets. These Harmonic patterns help traders to identify buying and selling opportunities in all markets and in all time-frames. The ABC and AB=CD patterns are first described by H.M. Gartley in his book
More...
Sep 01 2017 . The ABC Chart pattern and its related AB=CD Chart Pattern are prime examples of Symmetry in the markets. These Harmonic patterns help traders to identify buying and selling opportunities in all markets and in all time-frames. The ABC and AB=CD patterns are first described by H.M. Gartley in his book
More...
 Aug 01 2017 . One of the most popular chart patterns in market analysis is Head and Shoulders (H&S) pattern. The H&S patterns form near market tops in an established sideways to up trending or bullish markets. The H&S patterns are reversal patterns as they reverse its prior uptrend and follow a bearish or downtrend from its breakdown.
More...
Aug 01 2017 . One of the most popular chart patterns in market analysis is Head and Shoulders (H&S) pattern. The H&S patterns form near market tops in an established sideways to up trending or bullish markets. The H&S patterns are reversal patterns as they reverse its prior uptrend and follow a bearish or downtrend from its breakdown.
More...
 May 01 2017 . Rectangle channel patterns are one of the popular charting techniques and they are reliable chart patterns and they provide precise entry/exit/stop and target
trading levels. In general this type of pattern falls into a broader channeling pattern category along withascending channels (rising channels) or descending channels (falling).
More...
May 01 2017 . Rectangle channel patterns are one of the popular charting techniques and they are reliable chart patterns and they provide precise entry/exit/stop and target
trading levels. In general this type of pattern falls into a broader channeling pattern category along withascending channels (rising channels) or descending channels (falling).
More...
 Apr 01 2017 . Pattern manipulation is achieved when pattern recognition becomes a reflex action for the traders. When a trader is knowledgeable about patterns it is difficult not to see patterns within other patterns (embedded patterns). The recognition of patterns within patterns and its body of knowledge of how to react and what to expect helps a trader’s success.
More...
Apr 01 2017 . Pattern manipulation is achieved when pattern recognition becomes a reflex action for the traders. When a trader is knowledgeable about patterns it is difficult not to see patterns within other patterns (embedded patterns). The recognition of patterns within patterns and its body of knowledge of how to react and what to expect helps a trader’s success.
More...
 Mar 01 2017 . Symmetric Triangle is one of the most important chart patterns in technical analysis. Symmetric Triangles can be easily detected when prices make alternate lower highs and higher lows in upside and downside slopes were defining a clear symmetry.
More...
Mar 01 2017 . Symmetric Triangle is one of the most important chart patterns in technical analysis. Symmetric Triangles can be easily detected when prices make alternate lower highs and higher lows in upside and downside slopes were defining a clear symmetry.
More...
 Feb 01 2017 . Cup and Handle patterns are continuation patterns and they usually form in bullish trends. Most Cup and Handle patterns are very reliable and offer great trading opportunities. They also form in all markets and in all time-frames.
More...
Feb 01 2017 . Cup and Handle patterns are continuation patterns and they usually form in bullish trends. Most Cup and Handle patterns are very reliable and offer great trading opportunities. They also form in all markets and in all time-frames.
More...
 Jan 13 2017 . Megaphone patterns are rare and intricate patterns. Megaphone patterns are considered both reversal and continuous patterns and usually appear at the major tops and market bottoms. This pattern may be also called as Inverted Symmetric Triangle pattern or Broadening pattern and usually develops after a strong up or down trend in the stock price.
More...
Jan 13 2017 . Megaphone patterns are rare and intricate patterns. Megaphone patterns are considered both reversal and continuous patterns and usually appear at the major tops and market bottoms. This pattern may be also called as Inverted Symmetric Triangle pattern or Broadening pattern and usually develops after a strong up or down trend in the stock price.
More...
 Dec 07 2016 . The bullish Dragon pattern is similar to the ‘W-Bottom’ pattern. Inverse Dragon patterns (Bearish) are similar to ‘M’ patterns. Bullish Dragon patterns usually form at market bottoms and Bearish Dragon patterns form at the market tops. Dragon patterns work in all time frames and all market instruments.
More...
Dec 07 2016 . The bullish Dragon pattern is similar to the ‘W-Bottom’ pattern. Inverse Dragon patterns (Bearish) are similar to ‘M’ patterns. Bullish Dragon patterns usually form at market bottoms and Bearish Dragon patterns form at the market tops. Dragon patterns work in all time frames and all market instruments.
More...
 Nov 07 2016 . The ABC Chart pattern and its related AB=CD Chart Pattern are prime examples of Symmetry in the markets. These Harmonic patterns help traders to identify buying and selling opportunities in all markets and in all time-frames.
More...
Nov 07 2016 . The ABC Chart pattern and its related AB=CD Chart Pattern are prime examples of Symmetry in the markets. These Harmonic patterns help traders to identify buying and selling opportunities in all markets and in all time-frames.
More...
 Nov 07 2016 . Parabolic Arc chart patterns form when a steep rise in prices caused by irrational buying and intense speculation. Parabolic Arc patterns are rare but they are reliable and are generated in mega bull trends.
More...
Nov 07 2016 . Parabolic Arc chart patterns form when a steep rise in prices caused by irrational buying and intense speculation. Parabolic Arc patterns are rare but they are reliable and are generated in mega bull trends.
More...
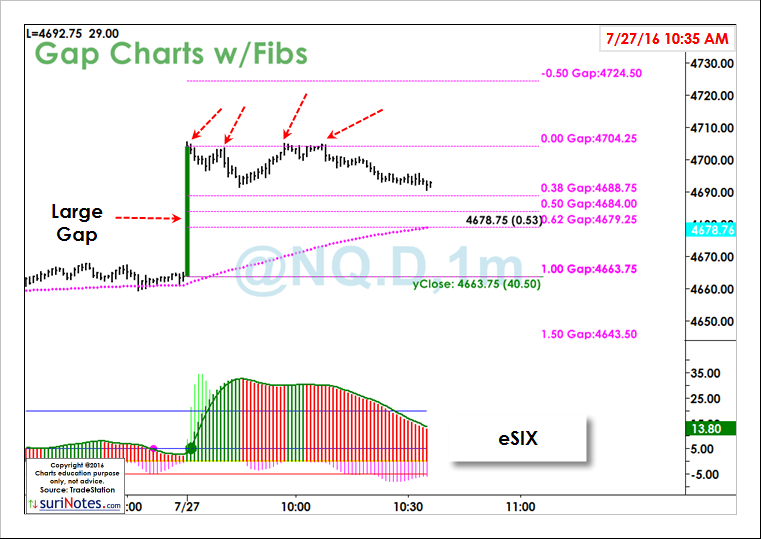 July 27 2016 . GAPS are overnight moves that occur in all instruments. GAPS are only applicable when measured in Regular Trading Hours (RTH) charts. GAPS phenomena occur mostly at the Opening of a day
More...
July 27 2016 . GAPS are overnight moves that occur in all instruments. GAPS are only applicable when measured in Regular Trading Hours (RTH) charts. GAPS phenomena occur mostly at the Opening of a day
More...