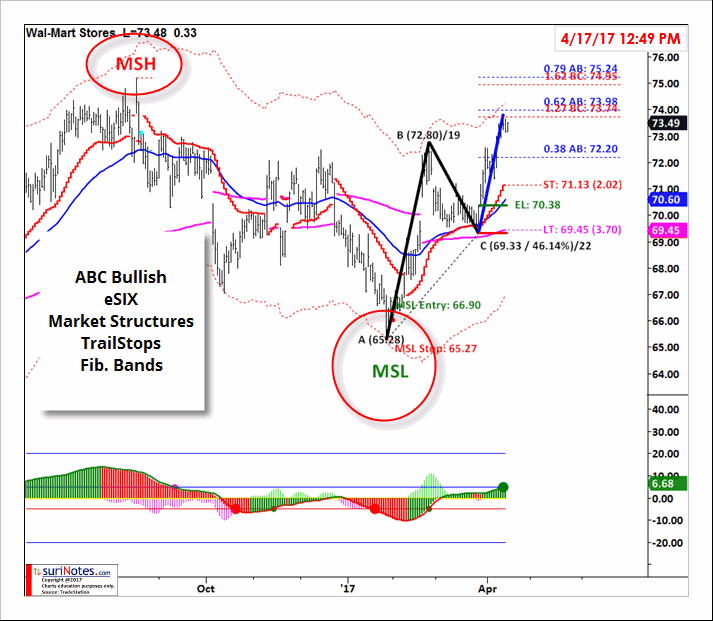
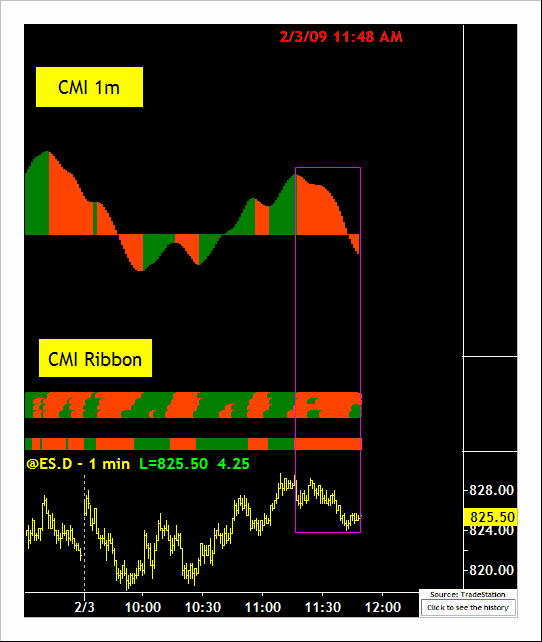
. .
  ABC Pack6 --- ComboPackage: ABC Pack5 --- AutoABC + eSIX + Market Structures + TrailStops, Fib. Bands, CMI (Real-Time)

ABC Pack5 consists of 6 (SIX) Indicators: AutoABC , Market Structures, eSIX, TrailStops, FibBands and CMI Indicators. Auto ABCV4 version is either for Stocks/Futures or FX Version. Pl. see Auto ABC or Fib. Bands or eSIX or Market Structures or TrailStops or CMIpages for more details.

All Product Licenses: TradeStation 9.5 or TradeStation 10+, Permanent Licenses, One-Time Fee, Single User and Protected Code.

If you are having difficulties with Paypal Cart, Please send an email to suriNotes@gmail.com to receive an authorization for direct Paypal payment link.
ABC Pack6 - Auto ABC V4 (Charts) + eSIX (Charts) + Fib. Bands + Market Structures (Charts) + TrailStops (Charts)+CMI
$3995
If you are having difficulties with Paypal Cart, Please send an email to suriNotes@gmail.com to receive an authorization for direct Paypal payment link.
ABC Pack6 - Auto ABC V4 (Charts+RadarScreen) + eSIX (Charts+RadarScreen) + Fib. Bands + Market Structures (Charts+RadarScreen) + TrailStops (Charts) + CMI
$4995


Screen Shots
Key Features

  • 6 Indicators: ABC V4 for Stocks/Futures OR FX + Fib. Bands + eSIX, Market Structures+TrailStops+CMI
  • Works in all time-frames.
  • Plots the Fib. Box in Real-time to show the potential Retracements and Extensions.
  • Plots the Potential Targets in Real-time
  • Plots Entry setup and Stop dynamically.
  • All variables, Colors, Targets are configurable.
  • Light weight; Programmed for Efficiency.
  • Works with TradeStation 9.+
 New
[+] Auto Harmonic Swings with PRZ
[+] TrailStops
[+] eSix
[+] EquiVolume with Trend
[+] Volume at Price
[+] AutoCharts
 Chart Patterns
[+] Auto-ABC with Targets(Stocks/Futures)
[+] Auto-ABC with PRZ and Targets(FX)
[+] Auto Harmonic Patterns(X5 - Gartley/Butterfly/Crab/Shark) with PRZ/Targets
[+] Auto Harmonic Swings with PRZ
[+] 2B Top/Bottom
[+] Market Structures
[+] Cup and Handle
[+] Head and Shoulders
[-] Dragon Pattern
[-] MegaPhone
[-] AB=CD
[-] W5 (5-Waves) Pattern
[-] 3-Drives
[-] Parabolic Arc
 Indicators
[+] TrailStops
[+] Volume at Price
[+] EquiVolume with Trend
[+] CMI (Combined Market Internals)
[+] Gap Charts
[+] Volatility Zones (VLTY)
[+] Relative Strength Rankings
[+] Expected Move
 Trend Tools
[+] SuperBars
[+] CMI (Combined Market Internals)
[+] eSix
  Pivots
[+] Globex Pivots
[+] Fib. Zone Pivots
[+] Opening Range Pivots
[+] Floor Pivots with Broadcast
 Fibonacci Tools
[+] Intraday Fibs
[+] FibClusters
[+] FibBands
[+] vWap Bands
[+] Opening Range Pivots w/Fibs
  TradingApps
[+] Chart Simulator - Daily Ver.
[+] ChartNotes (Journal Tool)
[+] IVRank
[+] EarningsCalendar
[+] AutoCharts
[+] Open Multiple Charts
[+] GannSQ9 Calculator
 Tools
[+] Screen Capture
[+] BarStrength
[+] BarTime Plots
[+] $Tick Crossings
 Functions (TS)
[+] eSix Function
[+] SuperBars Function
[+] EquiVolume Trend Function
[+] Screen Capture
[+] CMI Function
[+] Fib. Bands Function
[+] Market Structures Function
[+] Volatility Zones Function
 Combo Package Offers
[+] ABCPack1: AutoABC + FibBands
[+] ABCPack2: AutoABC + eSIX +FibBands
[+] ABCPack3: AutoABC + eSIX+FibBands+TrailStops
[+] ABCPack4: AutoABC + eSIX+FibBands+Market Structures
[+] ABCPack5: AutoABC + eSIX+FibBands+Market Structures+TrailStops
[+] ABCPack6: AutoABC + eSIX+FibBands+Market Structures+TrailStops+CMI

Copyright © 2008-2023, suriNotes.com, All Rights Reserved ®


FULL Disclaimer/Terms & Conditions

DISCLAIMER: THE RISK OF LOSS IN INVESTING STOCKS, FUTURES, OPTIONS, FOREX OR COMMODITIES CAN BE SUBSTANTIAL. YOU SHOULD THEREFORE CAREFULLY CONSIDER WHETHER SUCH INVESTMENTS ARE SUITABLE FOR YOU IN LIGHT OF YOUR FINANCIAL CONDITION, YOUR INVESTMENT EXPERIENCE AND OBJECTIVES, FINANCIAL RESOURCES AND OTHER RELEVANT CIRCUMSTANCES. PAST PERFORMANCE IS NOT NECESSARILY INDICATIVE OF FUTURE RESULTS, AND LOSSES ARE ALWAYS POSSIBLE. THE STRATEGIES OR TRADE SETUPS MENTIONED HEREIN SHOULD NOT BE CONSTRUED AS CONSERVATIVE STRATEGIES BUT RATHER SPECULATIVE AND FOR SHORT-TERM TRADING PURPOSES ONLY. THERE IS EQUAL OR GREATER POTENTIAL FOR LOSS WHILE USING THIS STRATEGY AND TRADE SETUPS.

All information, graphs and depictions represented in this site are OPINIONS and HYPOTHETICAL PERFORMANCE RESULTS and should be recognized as such and are not solicitations or instructions to execute orders. You shall be responsible for any decision to purchase and/or sell any of the futures products depicted herein. The owner of this site makes this material available to the public but assumes absolutely no responsibility or liability. The website contains links to other websites. These links are provided as references to identify and locate other internet resources that may be of interest. These other websites were developed by parties independent of the owner of this site and as such the owner does not assume responsibility for the accuracy or appropriateness of the information contained at, or endorse the viewpoints expressed at, such websites. Copying with intent to redistribute any part of this website is expressly prohibited without prior written consent and is and punishable under United States copyright law. All rights reserved.