Inverse Head and Shoulders Pattern
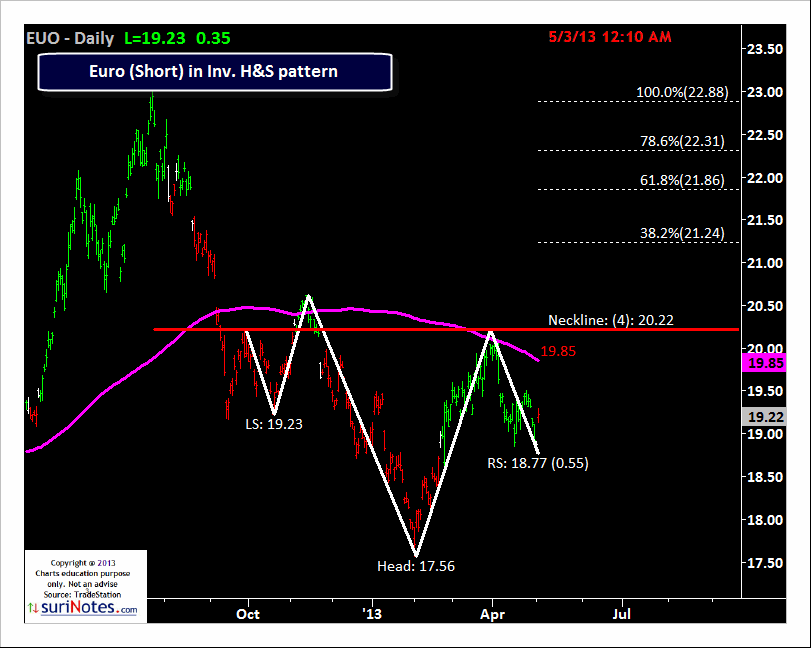
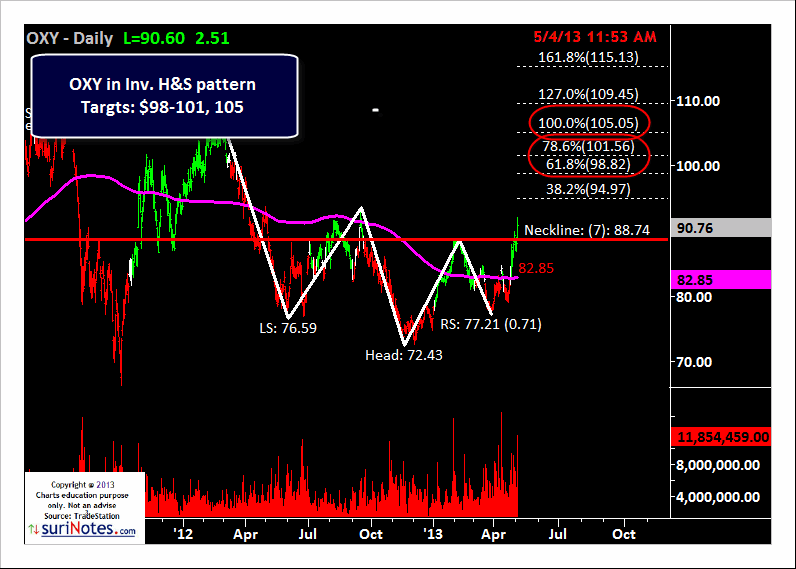
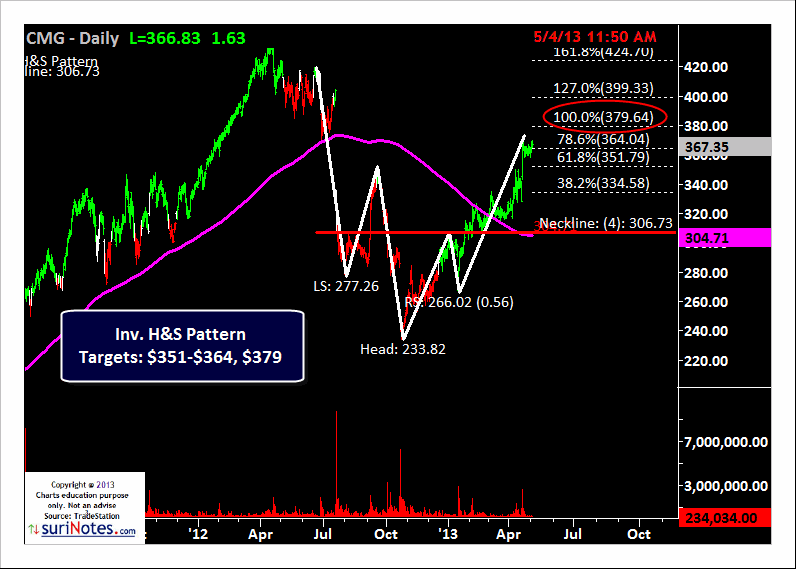
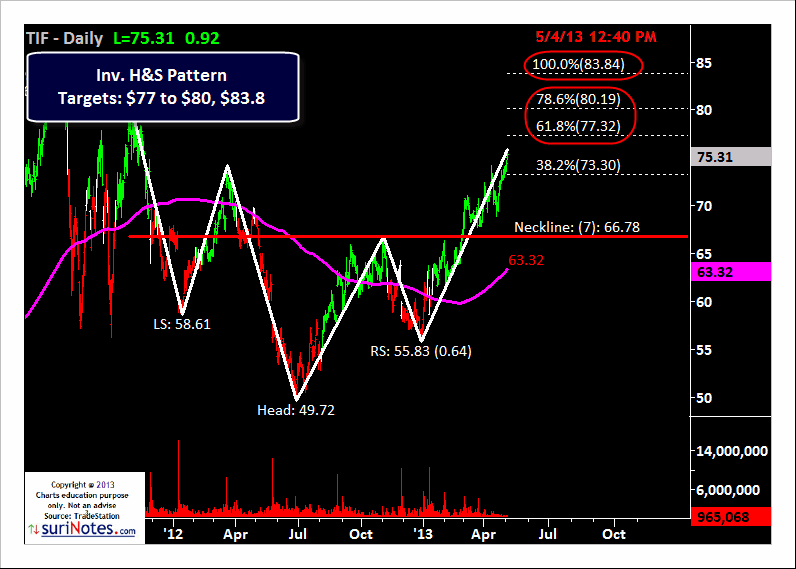
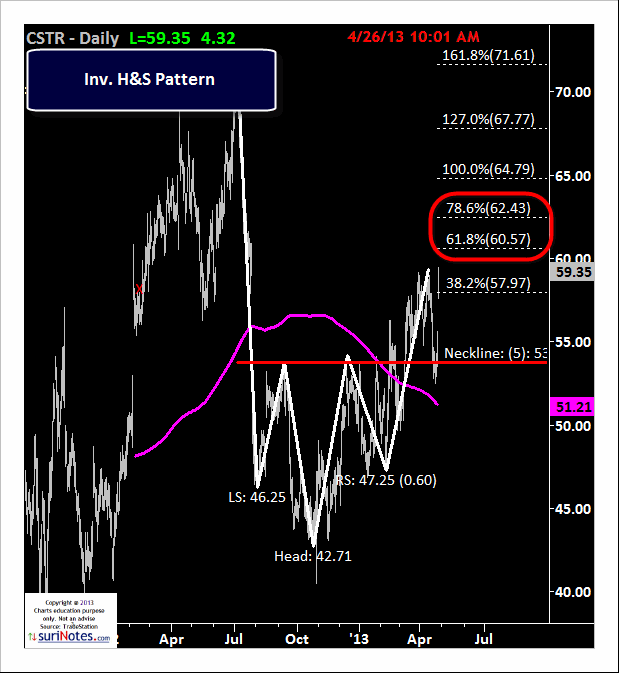
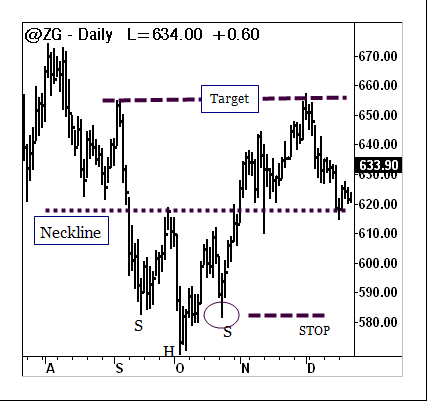
Inverse Head and Shoulders patterns are mirror images of Head and Shoulders patterns. They are formed with inverse shoulder (like valley), another larger valley (head part) and followed by another valley (second shoulder). A neckline is drawn connecting three top parts of the valleys using a trend line. This neckline is used as a way to signal or trigger a trade and measure targets. Inverse Head and Shoulders pattern is very reliable pattern. They are more effective when patterns are formed at the end of down-trend.

Inv. Head and Shoulders patterns can be validated using volume patterns. During the left shoulder and the beginning of the “Head” formations, the volume will be heavy. While forming, volume dissipates on the right shoulder, and the volume increases during the breakouts. A trend line or neckline is drawn connecting the Inverse Head and Shoulders pattern to determine the potential trade opportunities and targets.
How to Trade
Inverse Head and Shoulders Pattern
Trading patterns must have two key components: 1. Pattern Integrity and 2. Market Context. Patterns must be properly constructed and uniformly formed before a trade is considered. Patterns must agree with market conditions and market context tools. Also patterns must meet its key trading rules for successful execution and successful trading.

Trade:
Inverse Head and Shoulders pattern is defined by two shoulders, a Head and a neckline connecting the tops of the Shoulders and Head. When price closes below the neckline, a potential short trade is signaled. Short one tick below the breakdown bar’s low. Target: Compute the vertical distance between the “apex” of the Inv. Head and Shoulders pattern and the neckline. The target is set above this distance from the neckline. Stop: If the price closes below the neckline, a potential failure of the Inv. Head and Shoulders pattern is signaled. Place a “stop” order above the neckline. A secondary stop is placed the mid-distance between the right-shoulder and the neckline. If price closes below this midline, close the trade.
Trade Examples

Copyright © 2008-2025, suriNotes.com, All Rights Reserved ®


FULL Disclaimer/Terms & Conditions

DISCLAIMER: THE RISK OF LOSS IN INVESTING STOCKS, FUTURES, OPTIONS, FOREX OR COMMODITIES CAN BE SUBSTANTIAL. YOU SHOULD THEREFORE CAREFULLY CONSIDER WHETHER SUCH INVESTMENTS ARE SUITABLE FOR YOU IN LIGHT OF YOUR FINANCIAL CONDITION, YOUR INVESTMENT EXPERIENCE AND OBJECTIVES, FINANCIAL RESOURCES AND OTHER RELEVANT CIRCUMSTANCES. PAST PERFORMANCE IS NOT NECESSARILY INDICATIVE OF FUTURE RESULTS, AND LOSSES ARE ALWAYS POSSIBLE. THE STRATEGIES OR TRADE SETUPS MENTIONED HEREIN SHOULD NOT BE CONSTRUED AS CONSERVATIVE STRATEGIES BUT RATHER SPECULATIVE AND FOR SHORT-TERM TRADING PURPOSES ONLY. THERE IS EQUAL OR GREATER POTENTIAL FOR LOSS WHILE USING THIS STRATEGY AND TRADE SETUPS.

All information, graphs and depictions represented in this site are OPINIONS and HYPOTHETICAL PERFORMANCE RESULTS and should be recognized as such and are not solicitations or instructions to execute orders. You shall be responsible for any decision to purchase and/or sell any of the futures products depicted herein. The owner of this site makes this material available to the public but assumes absolutely no responsibility or liability. The website contains links to other websites. These links are provided as references to identify and locate other internet resources that may be of interest. These other websites were developed by parties independent of the owner of this site and as such the owner does not assume responsibility for the accuracy or appropriateness of the information contained at, or endorse the viewpoints expressed at, such websites. Copying with intent to redistribute any part of this website is expressly prohibited without prior written consent and is and punishable under United States copyright law. All rights reserved.